

Data pipelines optimized for speed.
Engineered database schemas and interactive Power BI dashboards designed to eliminate latency and deliver executive-ready business intelligence.
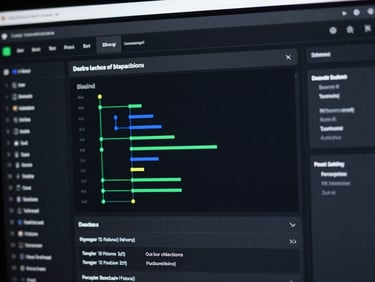
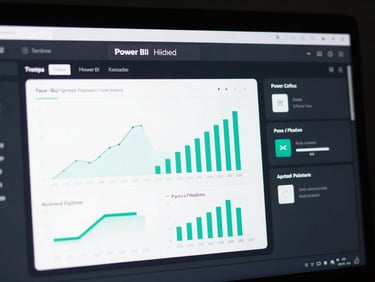

Production-ready business intelligence.
Every project pairs rigorous database engineering with executive-ready visualization to deliver measurable financial and operational impact.
Query Latency Reduction
Executive Revenue Dashboard
Automated Reporting Pipeline
Optimized complex SQL schemas and indexing strategies for an enterprise retail database handling millions of transaction rows.
Developed interactive executive-ready reports translating fragmented sales data into real-time visual insights for board-level decisions.
Engineered end-to-end Python scripts that extract, clean, and load weekly operational datasets, completely eliminating manual entry errors.
82%
faster query execution
$140K
operational savings identified
14 hrs
saved weekly
Structured query logic.
Ingestion & Cleaning
Statistical Modeling
Visual Storytelling
Extracting unstructured datasets using optimized SQL queries and Python scripts to ensure absolute data pipeline integrity.
Applying rigorous statistical analysis to identify trends, anomalies, and operational bottlenecks within the clean data.
Designing high-fidelity Power BI and Tableau dashboards tailored specifically for rapid, executive-level decision making.
Optimize your data pipelines.
Let's discuss how we can reduce your dashboard latency and build executive-ready reports for your team.